
A lifetime or so ago, I sat around a conference table with folks from the Rocky Mountain Victim Law Center (RMvlc) and several community- and system-based agencies who worked with crime victims and survivors in Denver. The group was interested in responding to a solicitation from the Office for Victims of Crime (OVC) to make the case that Denver should be a demonstration site for building wraparound legal services for crime victims and survivors.
RMvlc took the lead and Denver got the grant. And eventually, those early conference-room aspirations became the Legal Information Network of Colorado (LINC).
Along the way, there was a lot of data involved.
That’s where our team came in. OVC required each demonstration site to work with a research partner to conduct a needs assessment that would guide development of a wraparound approach that was responsive to the community. We worked with the project’s Steering Committee to design an approach that would help us all better understand crime victims’ legal needs as well as the barriers to getting those needs met. (Spoiler alert: The needs were many and the barriers high. For more on that situation, check out Every 90 Seconds). We started with interviews and focus groups, taking what we learned to develop a survey of legal needs, which we have since published to make available for other communities to use.
When the survey was ready, our team began to invite practitioners to share their observations about legal needs and barriers in their communities — each and every month since 2015. In turn, we summarized those monthly responses for the Steering Committee so they could use the information in real-time to inform their efforts to develop, launch, and strengthen their approach to wraparound legal services after crime.
Our updates always included a lot of caveats. For example, we would share the top-rated barriers each month but stop short of saying one barrier was significantly higher than another. We would show pretty charts of average ratings of barriers from month-to-month but hold back on saying whether the barriers were actually going up or down, statistically speaking.
Our hedging was driven by an underlying statistical problem that is common in victim service and other social science research: Most of the statistical approaches we and other researchers use are designed to check for change based on looking at what the exact same people say over time. In our long-term work with RMvlc, using that typical approach would require hearing from the same people each month, every month, over years — and wouldn’t allow us to add in new people over time. As you can imagine, that’s an impossible situation in our field where practitioners are busy and might not open the invitation one month or change agencies the next month.
So we hedged every single time we talked about the data because we couldn’t run the usual statistical analyses that would let us make firmer claims. Instead, we showed graphs of data while reminding Steering Committee members that barriers might look like they were going up (or down)…but the shifts might just be noise and not actual statistical change. Our warnings were similar to when political pollsters point to margins of error to warn that races might be closer to tied than they seem from a graph.
Of course, every now and then, shifts in the data were so striking that we were confident that the changes reflected meaningful, real-world change. For example, needs and barriers related to immigration spiked after the 2016 election and stayed high. However, such dramatic changes were rare, so we kept hedging.
We also kept working to find a better way to handle the data. And finally succeeded.
Eventually, we realized that we had to come at the data problem in a new way. We turned to the public health literature for inspiration. Public health researchers monitor all kinds of change over time but with a twist: They are often able to surveille population-level data — that is, data from everyone that they’re interested in. For example, they might track all deaths in automobile accidents reported by police. And then they might compare the number of deaths before and after a change in seatbelt safety or a shift in laws to determine if those changes mattered for keeping people alive. This overall approach is called an interrupted time series design, where researchers test whether a policy interrupts overall trends in data.
Adi Rosenthal and I wondered if we could adapt that public health approach to monitoring legal needs and barriers in Colorado. To do so, we stopped trying to focus on the same individuals month-to-month. Instead, we started thinking of each month as a snapshot of what was happening in the community with different people contributing to that snapshot over different months. Where having different people each month was a problem in our original approach, we started to think about this as a strength for surveilling barriers and needs.
To check whether this approach would work for detecting statistically significant changes over time, we leveraged the havoc that the early COVID-19 crisis had on victim service agencies.
You see, back when the COVID crisis was unfolding, we had amended our monthly surveys to include a few open-ended questions about the challenges agencies and clients were facing. We coded those open-ended responses to identify the biggest changes practitioners were seeing. We then used that coding to identify corresponding items from the monthly surveys that we had been collecting since 2015. We figured that if the public-health-inspired-snapshot-approach was going to work, we would be able to detect the effects of stay-at-home orders on those specific items.
Thinking of each month’s data as a snapshot, then, we tested whether we could detect differences before, during, and after COVID lockdowns. In fact, we tested two different patterns to ask whether the monthly snapshots pointed to transient or sustained change during those initial months as the COVID crisis unfolded.
We found strong evidence that we could use the monthly snapshots to pick up on significant increases in barriers related to 1) basic needs interfering with legal needs, 2) the time the court system took, and 3) technology. The image below illustrates this approach with the snapshots of technology barriers.
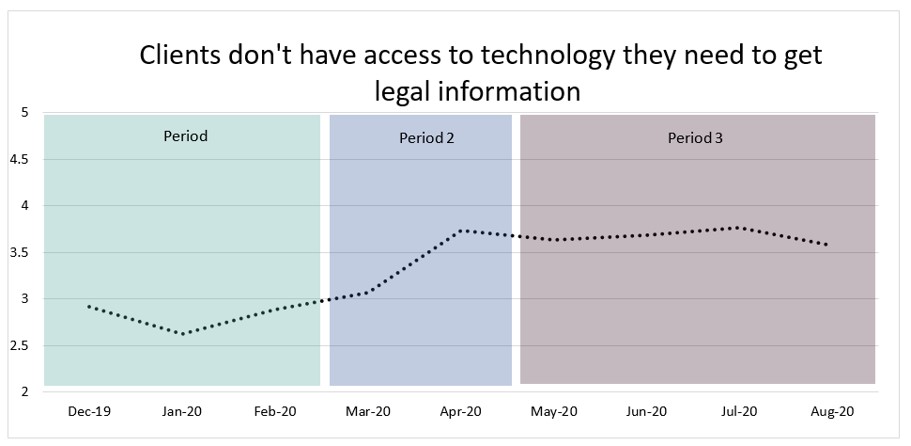
The statistically significant pattern of change matched what we heard from Steering Committee meetings at the time: Even when stay-at-home orders lifted, court backlogs and technology challenges persisted.
Of course, all this toiling with how to analyze data might sound like a rather academic exercise. Fair point – and we are academics after all. But here’s the thing: In an age of multidisciplinary teams and collaborative problem-solving, it’s a big deal to figure out new ways to monitor system- and community-wide change.
As funding cuts and policy changes that have the potential to profoundly affect victim services unfold across the country, being able to understand and tell a data-driven story of impact is as (or more) important than ever. I hope that the lessons we learned through our collaboration with RMvlc — described in a new research article — can help researcher-practitioner partners to find creative ways to use data to meet the needs of victims, survivors, and our communities. [50 free copies of the article are available through this link.]
***
Notes: Thank you to RMvlc for years and years of collaboration that made this work possible. For more stories of data, victim services, and changing the world, check out Every 90 Seconds, available from Oxford University Press or:


